Bio Lamps

Bio Lamps 

cool idea 
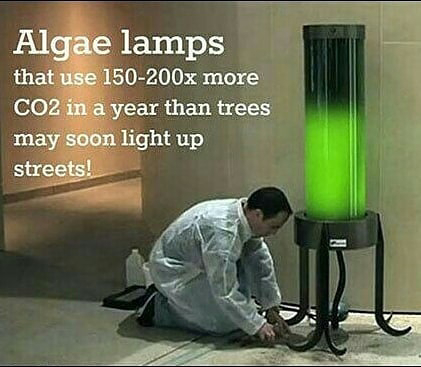
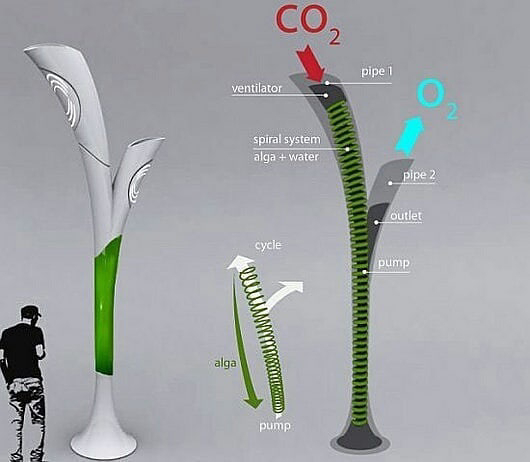
(CO2 — water + algae — O2 &Bio mass(Bio fuel))
The “Concept of Bio-lamp,” is…that  which converts carbon-dioxide into fuel to power the street lamps, and also  providing a clean and healthy environment for the people.
This Street Bio-lamp system will contain an algae solution mixed with water, which transforms carbon-dioxide into oxygen; and this carbon-dioxide or smog is pulled into the street Bio-lamp with the help of pump that sucks the smog into the spiral system from the top.
During the daytime, the streetlamp uses sunlight, carbon-dioxide and water to transform the algae into biomass that can be converted into fuel to power the lamps, and some of it is deposited into the lamp itself to power it during the night, or to power it when the there is no sunlight.
.
All the extra biomass is transferred through an underground pipe system to a closest filler station, where it can be transformed into usable fuel for other Eco-technologies like Eco-cars etc.
Thank you for reading so far I hope you found something useful from this post, then please give us a subscribe, this will really encourage us to do more.

DO YOU KNOW HOW MUCH INDIA IMPORT GOODS

DO YOU KNOW HOW MUCH INDIA IMPORT GOODS

CAIT — The Confederation of All India Traders. Data list depend by kitchen bedroom washroom maximum used things chinese product. 
As a nation together chinese import items
One year spend 70 Billion Dollars(5341315000000 Indian rupees)

China import in Percentage :
Gray Scale Photo of Gears 
Mechanical and electrical 45%


Pile of White Pink and Brown Oblong and Round Medication Tablet
Pharmaceutical 65-75%


Assorted Iphone Lot
Smartphones 90%

Free stock photo of appartment, at home, beautiful home, company
Television 45%


Lord Ganesha Statuette
Ganesh statue 


Yellow Fireworks Illustration
Diwali & holly celebration items 

How To Get GDP Data

Business strategy GDP. Chart made with chalk on a blackboard stock images

Sources for GDP Data

 The world bank hosts one of the most reliable web-based databases. It has one of the best and most comprehensive lists of countries for which it tracks GDP data. The International Money Fund (IMF) also provides GDP data through its multiple databases, such as World Economic Outlook and International Financial Statistics.


Highly reliable source of GDP data is the Organization for Economic Cooperation and Development (OECD). The OECD provides not only historical data but also forecasts for GDP growth.

The disadvantage of using the OECD database is that it tracks only OECD member countries and a few nonmember countries.

Importance of GDP
GDP is used as an indicator for most governments and economic decision-makers for planning and policy formulation


In case of GDP, each component is given the weight of its relative price. In market economics it clicks as prices reflect both marginal cost of the producer and marginal utility for the consumer, i.e. people sell at a price that others are willing to pay

GDP helps the investors to manage their portfolios by providing them with guidance about the state of the economy

Calculation of GDP provides with the general health of the economy. A negative GDP growth portrays bad signals for the economy. Economists analyse GDP to find out whether the economy is in recession, depression or boom


The GDP of a country can be calculated in the below mentioned rates

  • Expenditure approach,
  • Income approach
  • Value-added approach

Following is a simple way to calculate the GDP. GDP = consumption + investment + government spending) + (exports-imports) and the formula is                                              GDP = C + I + G + (X-M) 


where:

C= spending by consumers,
I= investment by businesses,
G= government spending and

(X-M)= net exports, that is, the value of exports minus imports. Net exports may be negative i.e. imports are more than exports.

Best Air Purifying Houseplants

Best Air Purifying Houseplants
Green Potted Plants Near Closed Window

Barberton Daisy
Baberton, Baberton Daisies, Daisy
Place the plant in a room with plenty of natural light and keep the soil moist but well-drained


English Lvy
Plant Rx: 5 Tips for Raising English Ivy Indoors | Costa Farms
Needs generous watering and 4 hours of direct sunlight a day


Snake Plant
Snake Plant, Houseplant
Be mindful not to overwater, as the roots are prone to rot in moist soil


Spider Plant
Spider Plant Care: Tips on How to Care for a Spider Plant

Provide them with well-drained soil and bright ,indirect light. Avoid over watering


Chrysanthemum
Chrysanthemum, Flowers, Flora, Autumn
The plant loves sunlight ,so place it in a spot near a sunbathed window


Aloe Vera
Aloe Vera, Succulent, Potted, Plant
place in bright and indirect sunlight or artifical light


Find Highest Ever Level Of Microplastics On Seafloor

Find Highest Ever Level Of Microplastics On Seafloor


Over 10 million tons of plastic waste enters the oceans each year. Floating plastic waste at sea has caught the public’s interest thanks to the ‘Blue Planet Effect’ seeing moves to discourage the use of plastic drinking straws and carrier bags. Yet such accumulations account for less than 1% of the plastic that enters the world’s oceans.
The missing 99% is instead thought to occur in the deep ocean, but until now it has been unclear where it actually ended up. Published this week in the journal Science, the research conducted by The University of Manchester (UK), National Oceanography Centre (UK), University of Bremen (Germany), IFREMER (France) and Durham University (UK) showed how deep-sea currents act as conveyor belts, transporting tiny plastic fragments and fibres across the seafloor.

Garbege Whale Underwater Envir...
These currents can concentrate microplastics within huge sediment accumulations, which they termed ‘microplastic hotspots’. These hotspots appear to be the deep-sea equivalents of the so-called ‘garbage patches’ formed by currents on the ocean surface.
The lead author of the study, Dr Ian Kane of The University of Manchester said: “Almost everybody has heard of the infamous ocean ‘garbage patches’ of floating plastic, but we were shocked at the high concentrations of microplastics we found in the deep-seafloor.

“We discovered that microplastics are not uniformly distributed across the study area; instead they are distributed by powerful seafloor currents which concentrate them in certain areas.”
Microplastics on the seafloor are mainly comprised of fibres from textiles and clothing. These are not effectively filtered out in domestic waste water treatment plants, and easily enter rivers and oceans.
In the ocean they either settle out slowly, or can be transported rapidly by episodic turbidity currents — powerful underwater avalanches — that travel down submarine canyons to the deep seafloor (see the group’s earlier research in Environmental Science & Technology). Once in the deep sea, microplastics are readily picked up and carried by continuously flowing seafloor currents (‘bottom currents’) that can preferentially concentrate fibres and fragments within large drifts of sediment.
These deep ocean currents also carry oxygenated water and nutrients, meaning that seafloor microplastic hotspots can also house important ecosystems that can consume or absorb the microplastics. This study provides the first direct link between the behaviour of these currents and the concentrations of seafloor microplastics and the findings will help to predict the locations of other deep-sea microplastic hotspots and direct research into the impact of microplastics on marine life.
The team collected sediment samples from the seafloor of the Tyrrhenian Sea (part of the Mediterranean Sea) and combined these with calibrated models of deep ocean currents and detailed mapping of the seafloor. In the laboratory, the microplastics were separated from sediment, counted under the microscope, and further analysed using infra-red spectroscopy to determine the plastic types. Using this information the team were able to show how ocean currents controlled the distribution of microplastics on the seafloor.
Dr Mike Clare of the National Oceanography Centre, who was a co-lead on the research, stated: “Our study has shown how detailed studies of seafloor currents can help us to connect microplastic transport pathways in the deep-sea and find the ‘missing’ microplastics. The results highlight the need for policy interventions to limit the future flow of plastics into natural environments and minimise impacts on ocean ecosystems.”
Dr Florian Pohl, Department of Earth Sciences, Durham University, said: “It’s unfortunate, but plastic has become a new type of sediment particle, which is distributed across the seafloor together with sand, mud and nutrients. Thus, sediment-transport processes such as seafloor currents will concentrate plastic particles in certain locations on the seafloor, as demonstrated by our research.”

Wave, Water, Surf, Ocean, Sea, Spray

An international research project has revealed the highest levels of microplastic ever recorded on the seafloor, with up to 1.9 million pieces in a thin layer covering just 1 square metre.

The only way to reduce the amount of plastic and micro plastics in the ocean is to reduce the amount of plastic we use


Climate change may push some species to higher elevations — and out of harm’s way

Climate change may push some species to higher elevations — and out of harm’s way
Mountains, Landscape, Nature, Background
A new study published in Nature Communications by scientists at WCS, the University of California, Berkeley, and the United States Forest Service shows that nearly 60 percent of all mountainous area is under intense human pressure. Most of the pressure is at low elevations and mountain bases, which tend to be easier places for people to live, grow food, and build roads. The scientists then used climate models to make predictions about how species would move under climate change. Based on their predictions, they found that species tend to move to higher elevations, and that these higher elevations tend to have more intact land for species because there is less human pressure.
Without factoring in human pressure, the authors warn that conservation actions may be misguided. Factoring in human pressure reveals the true ‘shape’ of a mountain for species that are restricted to intact landscapes, which are often the species of greatest conservation concern. Here, the ‘true shape’ refers to how much land area is potentially available as habitat for a species as it moves up in elevation, not simply how much total land area is available. The true shape can reveal where species will tend to lose versus gain intact land area as they shift under climate change: the elevations where species are expected to lose area represent the priority zones for conservation.
Mountains are home to over 85 percent of the world’s amphibians, birds, and mammals, making them global conservation priorities. But mountain-dwelling species are at risk from human activities, such as agriculture, livestock grazing, and development that reduce their habitat, and climate change that threatens to push species upslope as they struggle to find tolerable temperatures.
“Species are adapted to certain temperature conditions. As temperatures warm in mountains, scientists have documented species moving to higher elevations to maintain the same temperatures,” said Paul Elsen, a WCS Climate Adaptation Scientist and lead author of the study. “This was always seen as a problem, because species would have less land area and less habitat to occupy at high elevations. But what we found is that as species move upslope, they tend to move away from areas that are already under intense human pressure and into areas with reduced human pressure. As a result, they can occupy more intact land area, even if the total amount of land area declines.”
The authors combined several global databases to make their assessments: high-resolution digital elevation models gave a picture about how much surface area is available at different elevations. The Human Footprint Index provided information on pressure from human activities. Global climate models projected how temperatures are likely to change by the late 21st century.
The authors then used computer simulations to place hundreds of thousands of hypothetical ‘species’ across all mountain ranges at different elevations and then predicted how they would shift their ranges based on climate projections. For each simulation, they compared the amount of area the species had to begin with to the amount they would have after the range shift under climate change.
Said Elsen: “We were surprised to find that many species had more intact land area available after the range shift compared to when they started.”
The results suggest that many species in mountain ranges may have more intact land area available in the future if they track warming temperatures to higher slopes, though there were exceptions.
“Our results offer a glimmer of hope for montane species under climate change,” Elsen said. “Montane species are still facing tremendous human pressure, especially at low elevations, but we have the opportunity now to protect intact habitats at higher elevations to give these species the best possible chance going forward.”

The Map Of Mathematics

The Map Of Mathematics


Unless you were a total pro at mathematics in high school, you probably only have a vague recollection of things like geometry, algebra, and some guy called Isosceles

And that sucks, because mathematics is one of the most fascinating languages humanity has ever devised, but without university-level expertise, you’re going to have a very bad time trying to figure out how things like chaos theoryand fractal geometry tie in with machine learning and all those crazy prime numbers we keep finding.
Enter YouTuber Dominic Walliman, who last December delivered this incredible Map of Physics, and is now back to help us find – or reclaim – a passion for all things numbers. 
“The mathematics we learn in school doesn’t quite do the field of mathematics justice – we only get a glimpse of one corner of it, but mathematics as a whole is a huge, and wonderfully diverse subject,” Walliman says in the video below.
To navigate this complex and busting Map of Mathematics, the best place to start is in the middle, where the orangey brown circle depicts the origins of human interest into how numbers explain our Universe:
We’ve then got two main sections that represent the two major fields in mathematics today – Pure Mathematics (an appreciation of the language of numbers itself) and Applied Mathematics (how that language can be used to solve real-world problems).
You can mess around with and download a high-res, zoomable version here, and print it on a throw pillow here, because we all need something to look at on the couch when Taboo is getting a little too weird.
To fully appreciate Walliman’s Map of Mathematics, you should definitely watch the video below to get the proper walkthrough.
All those names of things – topology, complex analysis, and differential geometry – might not sound like much to you now, but you’ll soon learn that they’re really just describing the shapes of things in our Universe, and the way those shapes change in time and space are explained by things like calculus and chaos theory.
Now that you’ve made it through the trickiest theoretical stuff, it’s on to applied Mathematics, which applies to the disciplines of physics, chemistry, and biology, where number systems are integral to understanding how the Universe and everything in it behaves. 
You’ve also got engineering, economics, and game theory, and probability, cryptography, and computer science – all of which simply wouldn’t exist had our very cluey ancestors not laid the foundations of number-sleuthing for us centuries ago.
What’s that? Mathematics literally applies to everything in life and the Universe? [Internal cheering by maths teachers intensifies]
If all of this sounds all too basic for you, don’t worry, there’s more to this map than just pure and applied mathematics.
It even covers what could be the biggest mystery of the entire discipline – how researchers examining the foundations of maths have failed to find a complete set of fundamental rules, called axioms, that are provably consistent across every little nook and cranny of the mathematical universe.

The Map of Physics

The Map of Physics

Physics is a huge, complex field. It also happens to be one of the most fascinating, dealing with everything from black holes and wormholes to quantum teleportation and gravitational waves.
But unless you have an innate knowledge of the field, it’s pretty hard to figure out how all these concepts actually fit together – and how they tie in with the stuff like the physics of inertia and circuits that we learnt in high school.
After all, everyone is constantly trying to prove Einstein wrong, and Stephen Hawking famously struggled to come up with a ‘theory of everything’, so it’s easy to get confused about how things do actually fit together in physics (if at all).
To straighten that out once and for all, YouTuber Dominic Walliman has created a map that shows how the many branches of physics link together, from the earliest days of classical physics and Isaac Newton, all the way through to Einstein’s relativity and quantum physics (with a little bit of philosophy thrown in there for good measure).
It takes you all the way from Newton’s falling apple to today’s scientists trying to peer inside black holes and find a theory to unify gravity with quantum mechanics.
The video shows that there’s a gaping “chasm of ignorance” that physicists need to fill in before we can truly understand how the Universe works. This includes things like dark matter and energy, which work in theory, but so far have never been directly observed or explained.
The bottom line in all of this is that, the more we learn, the more we realise how much we have left to discover, and that’s one of the things we love the most about science.
So, for anyone who’s ever hurt their brain by trying to think about what the Universe is expanding into, or what exactly space-time is made of, this is for you. Because when the history of physics is broken down into a palatable 8 minutes, it suddenly doesn’t seem so scary after all.

Tokyo 2020 shows off Olympic medals made from old phones

Image result for tokyo olympics 2020 medal hd images - ... images
Tokyo 2020 shows off Olympic medals made from old phones

Japan’s Tokyo 2020 has unveiled its Olympic medals made from recycled mobile phones. The Tokyo Organizing Committee of the Olympic and Paralympic Games said its Tokyo 2020 Medal Project sourced small electronic devices from all over Japan to create 5,000 gold, silver and bronze medals.
Tokyo 2020 had first announced it would be making its medals out of recycled electronics way back in February 2017, asking the public to donate its old or unwanted phones. Gold, silver and bronze were extracted from the phones, with the same method used in the Vancouver 2010 Olympic and Paralympic Winter Games.
“We hope that our project to recycle small consumer electronics and our efforts to contribute to an environmentally friendly and sustainable society will become a legacy of the Tokyo 2020 Games,” Tokyo 2020 said.
The medals symbolize the energy of athletes, as well as the diversity of the games, Tokyo 2020 said, while their brilliant “signifies the warm glow of friendship.”
The design of the medals also represents Japanese culture, with the ribbon showing off modernized ichimatsu moyo (checkered patterns) and kasane no irome (kimono layering techniques). The Tokyo 2020 colors are added to the ribbon through more co2-friendly chemically-recycled polyester fibers.
The medal cases are being created by Japanese craftworkers “with a blend of traditional and modern techniques.”
In another effort to infuse its culture into the Tokyo 2020 Olympic and Paralympic Games, Japanese artists are also re-creating flags of countries participating in the event as anime characters, though the project is not officially affiliated with the games.

The Smallest Computer in the World Fits On a Grain of Rice

Image result for world smallest computer hd image
Researchers at the University of Michigan just created the world’s smallest computer (again). Their previous micro-computer, the Michigan Micro Mote, measured 2x2x4mm. It was a complete, functioning system powered by solar cell batteries. But in March this year, IBM announced a new, smaller computer, which measured 1×1 mm, and was smaller than a grain of salt. It “raised a few eyebrows at the University of Michigan.”
After all, it’s unclear if the IBM computer even count as an actual microcomputer. The IBM device lost all its programming and data as soon as it turns off, unlike the Michigan Micro Mote, which retained its programming even when it wasn’t externally powered. “It’s more of a matter of opinion whether they have the minimum functionality required,” said David Blaauw, a professor of electrical and computer engineering at University of Michigan who helped develop the University of Michigan’s newest tiny device. If the IBM machine constituted a computer, then University of Michigan would work to gain back their title: their latest microdevice measures 0.3mm per side (1/10th the size of IBM’s computer), and is smaller than a grain of rice.
The device was designed to be a precision temperature sensor that can report temperatures in clusters of cells with an error of about 0.1 degrees Celsius. “When we first made our millimeter system, we actually didn’t know exactly all the things it would be useful for. But once we published it, we started receiving dozens and dozens and dozens of inquiries,” Blaauw said. It could, for instance, measure the temperature of tumors and conduct other cancer studies, monitor oil reservoirs, conduct audio or visual surveillance, or help in “tiny snail studies.”

Anti-Solar Cells Could Keep the Power Going at Night

Panel, Solar, Power, Energy, Environment

Anti-Solar Cells Could Keep the Power Going at Night


Solar panels that work at night? The idea isn’t as far-fetched as it might seem.

A University of California (UC), Davis engineering professor is developing prototypes of an “anti-solar” cell that would work in the opposite way from a typical solar panel. Instead of being cooler than the air and absorbing sunlight, it would be warmer than the air and give off infrared light.

“A regular solar cell generates power by absorbing sunlight, which causes a voltage to appear across the device and for current to flow,” the professor, Jeremy Munday, explained in a UC Davis press release. “In these new devices, light is instead emitted and the current and voltage go in the opposite direction, but you still generate power. You have to use different materials, but the physics is the same.”

Solar Panel Array, Power, Sun


While this might sound high tech, Euronews explained that the principle behind it has been used to cool homes at night for centuries:

You are using the same theory when you open your windows and doors after a hot day to cool down your house. Essentially this form of passive cooling uses the night sky as a massive heat sink, drawing warmth away from the earth once it gets dark.
Munday, who published a concept paper of his idea in the January 2020 issue of ACS Photonics, said that his device could generate around a quarter of the energy a traditional solar panel can during the day — that’s up to 50 watts of power per square meter. While less powerful, his device can be used at any time.


Solar Cell, Solar Panel, Photovoltaic

Solar cells are limited in that they can only work during the day, whereas these devices can work 24/7, which is the real advantage,” Munday told CNN. “Nobody wants to lose power once the sun sets.”

His “thermoradiative cell” would also work during the day if it were pointed away from the sun or otherwise blocked from direct sunlight, the press release explained.

Munday told CNN that the device could be used to achieve carbon neutrality, because it could run on waste heat generated by industry.

“While these panels can produce carbon-free power […] when attached to waste heat sources, they can also produce carbon-free power by just sitting on your roof, like a solar panel,” he said.

Munday is working on prototypes of these cells with the hopes of improving their efficiency and the amount of power they can generate, according to the press release. However, he acknowledged to CNN that traditional solar panels have “decades of development” on his idea.
Munday isn’t the only researcher to seek to generate renewable energy from the heat difference between Earth and space. In May of 2019, a team of international researchers announced that it was possible to generate electricity by pointing an infrared semiconductor at the sky.

“The vastness of the universe is a thermodynamic resource,” paper author Shanhui Fan said in an American Institute of Physics press release published by EurekAlert! at the time.

Why use a bamboo toothbrush?


plastic toothbrush versus bamboo toothbrushes


THE PLASTIC PROBLEM

plastic toothbrushes ocean pollution
You already know that plastic toothbrushes account for a global waste problem. Plastic is cheap, versatile and valuable resource in many ways. However, it has created a disposable lifestyle. 50% of plastic is just used once and thrown away.
 Plastic pollution is an unsustainable waste of that resource and it has become an environmental issue. So basically, do you want to continue being part of the problem or are you ready to take a small step to reduce our collective plastic footprint?
Plastic toothbrushes are made from polypropylene plastic (handle) and nylon (bristles), which are both sourced from non-renewable fossil fuels. They are essentially indestructible, which means that the first toothbrush we had when we were kids is still hanging around in some form, somewhere polluting Mother Earth.
Every year billions of plastic toothbrushes are thrown away. They are dumped into our oceans or end up in landfills, where they sit around for about 1000 years before finally breaking down.

Another staggering fact is that by 2050, the oceans will contain more plastic than fish by weightQuite scary, don’t you think? But the environmental damage is entirely preventable, if we take a small and simple action: switch to a biodegradable toothbrush.

This is bad news for three notable reasons—sourcing, toxicity and disposal.
  • Let’s begin with sourcing. Plastic toothbrushes are are no different to the majority of other plastic items; oil-derived. Oil is an increasingly scarce resource that is highly polluting in its extraction, processing and disposal of the waste material.
  • The bad news continues—most users of plastic toothbrushes are unaware of the toxicity hidden inside the product they use on a daily (hopefully twice a day), basis. Many brushes leach toxins such as BPA and phthalates which are linked to health problems including reproductive issues and cancer. 
  • The final issue with plastic toothbrushes comes to when its time to replace them. The vast majority of toothbrushes are not recyclable due to the mix of materials used in their manufacture, and the contaminated plastic in the bristles. As a result, most toothbrushes will end up in a landfill or worse, our seas, where over time they break up turning into microplastics (which we will be covering in a future blog post) —tiny but very harmful pieces of plastic that can kill marine life and even make their way into our food chain and drinking water.
Suddenly an innocuous, everyday item like a plastic toothbrush doesn’t seem so innocent as we think about the repercussions of using them instead of a sustainably-sourced, biodegradable, toxin-free, environmentally less hazardous, alternative. 
So what’s the answer? Drumroll please for the bamboo toothbrush. This unsung hero could be doing more for the environment than you think.
Bamboo is the fastest growing plant on earth (up to 3 metres a day for some species). This is an important characteristic as it makes bamboo a highly renewable and super sustainable crop, meaning a small patch of ground can repeatedly be harvested producing enormous amounts of raw materials.
Bamboo can also be cultivated without the use of pesticides or fertilisers which often contain highly toxic chemicals, and to top it off bamboo produces more oxygen and absorbs more carbon dioxide than any other plant.
Sounds like a great alternative to toxic and non-renewable, oil-based plastics!
What about disposal?
       Bamboo is biodegradable and can be safely returned to the soil via your compost heap or your local authority’s green waste without fear of leaching toxic chemicals into the environment (provided there’s no toxic paint on the handles).
This leaves only one thing, the elephant in the room, the bristles.
Traditionally toothbrush bristles are made from Nylon which is durable and flexible and provides a good source of abrasion, making it an ideal candidate for brushing your teeth, but it’s not so great for the environment.
The manufacturing process for Nylon is a substantial source of greenhouse gas emissions and the single most significant source of plastic-pollution in our oceans.
Many companies that produce bamboo toothbrushes will neglect to tell you their bristles are  Nylon, which can add complexity to their disposal and undermine the efforts of customers trying to live plastic-free.
A common biodegradable alternative is the traditional hogs hair bristle. This is, in my opinion, fairly gross and probably a non-starter as other options go—not only can it be seen as a cruel practice to pluck the hair off a hog’s body to make bristles, it’s also unhygienic as hog’s hairs are hollow and as such are a refuge for bacteria.
plastic toothbrush versus bamboo toothbrushes

If you’re interested, you can find our toothbrush on Amazon at the Link below.

A New Way To Remove Contaminants From Nuclear Wastewater

Nuclear Power Plant, Cooling Tower, Sunrise, Mood

Nuclear power continues to expand globally, propelled, in part, by the fact that it produces few greenhouse gas emissions while providing steady power output. But along with that expansion comes an increased need for dealing with the large volumes of water used for cooling these plants, which becomes contaminated with radioactive isotopes that require special long-term disposal.

Now, a method developed at MIT provides a way of substantially reducing the volume of contaminated water that needs to be disposed of, instead concentrating the contaminants and allowing the rest of the water to be recycled through the plant’s cooling system. The proposed system is described in the journal Environmental Science and Technology, in a paper by graduate student Mohammad Alkhadra, professor of chemical engineering Martin Bazant, and three others.
The method makes use of a process called shock electrodialysis, which uses an electric field to generate a deionization shock wave in the water. The shock wave pushes the electrically charged particles, or ions, to one side of a tube filled with charged porous material, so that concentrated stream of contaminants can be separated out from the rest of the water. The group discovered that two radionuclide contaminants — isotopes of cobalt and cesium — can be selectively removed from water that also contains boric acid and lithium. After the water stream is cleansed of its cobalt and cesium contaminants, it can be reused in the reactor.
The shock electrodialysis process was initially developed by Bazant and his co-workers as a general method of removing salt from water, as demonstrated in their first scalable prototype four years ago. Now, the team has focused on this more specific application, which could help improve the economics and environmental impact of working nuclear power plants. In ongoing research, they are also continuing to develop a system for removing other contaminants, including lead, from drinking water.
Not only is the new system inexpensive and scalable to large sizes, but in principle it also can deal with a wide range of contaminants, Bazant says. “It’s a single device that can perform a whole range of separations for any specific application,” he says.
In their earlier desalination work, the researchers used measurements of the water’s electrical conductivity to determine how much salt was removed. In the years since then, the team has developed other methods for detecting and quantifying the details of what’s in the concentrated radioactive waste and the cleaned water.
“We carefully measure the composition of all the stuff going in and out,” says Bazant, who is the E.G. Roos Professor of Chemical Engineering as well as a professor of mathematics. “This really opened up a new direction for our research.” They began to focus on separation processes that would be useful for health reasons or that would result in concentrating material that has high value, either for reuse or to offset disposal costs.
The method they developed works for sea water desalination, but it is a relatively energy-intensive process for that application. The energy cost is dramatically lower when the method is used for ion-selective separations from dilute streams such as nuclear plant cooling water. For this application, which also requires expensive disposal, the method makes economic sense, he says. It also hits both of the team’s targets: dealing with high-value materials and helping to safeguard health. The scale of the application is also significant — a single large nuclear plant can circulate about 10 million cubic meters of water per year through its cooling system, Alkhadra says.
For their tests of the system, the researchers used simulated nuclear wastewater based on a recipe provided by Mitsubishi Heavy Industries, which sponsored the research and is a major builder of nuclear plants. In the team’s tests, after a three-stage separation process, they were able to remove 99.5 percent of the cobalt radionuclides in the water while retaining about 43 percent of the water in cleaned-up form so that it could be reused. As much as two-thirds of the water can be reused if the cleanup level is cut back to 98.3 percent of the contaminants removed, the team found.
While the overall method has many potential applications, the nuclear wastewater separation, is “one of the first problems we think we can solve [with this method] that no other solution exists for,” Bazant says. No other practical, continuous, economic method has been found for separating out the radioactive isotopes of cobalt and cesium, the two major contaminants of nuclear wastewater, he adds.
While the method could be used for routine cleanup, it could also make a big difference in dealing with more extreme cases, such as the millions of gallons of contaminated water at the damaged Fukushima Daichi power plant in Japan, where the accumulation of that contaminated water has threatened to overpower the containment systems designed to prevent it from leaking out into the adjacent Pacific. While the new system has so far only been tested at much smaller scales, Bazant says that such large-scale decontamination systems based on this method might be possible “within a few years.”
The research team also included MIT postdocs Kameron Conforti and Tao Gao and graduate student Huanhuan Tian.

Indian Forest Expanded by in Last 2 years

Environmental Protection, Nature Conservation, Ecology
The forest and tree cover in India risen by 5,188 square kilometers in the last two years. Karnataka is growing the maximum protection of 1,025 sq km. There is an increase of 3,976 sq. Km (0.56 percent) of forest cover and 1,212 sq. Km (1.29 percent) of tree cover compared to the 2017 report.
Different States – Forest 
The three states in terms of forest cover are KarnatakaAndhra Pradesh, and KeralaKarnataka grew the maximum forest-and-tree protection at 1,025 sq km, Andhra Pradesh grew a 990-sq. Km cover and an 823-sq.km of forest cover created by Kerala in the last two years. Two other states followed are Jammu and Kashmir, which grew a 371-sq. Km forest cover, and Himachal Pradesh. The current assessment shows an increase of 544 sq. Km (0.19 percent) in 140 hill districts of the country. The forest data of Jammu and Kashmir, recorded through satellite imaging, covers areas outside LoC that are under the illegal occupation of Pakistan and China. The north-east did not show positive results as the current assessment showed a decrease of forest cover to the extent of 765 sq. Km (0.45 percent) in the region. The total forest cover of India is 7,12,249 sq. Km is 21.67 percent of the geographical area of the country. The tree cover of the country is estimated at 95,027 sq. Km, which is 2.89 percent of the geographic area. India on track to achieve its climate goal of creating an additional carbon sink of 2.5-3 billion tonnes under the Paris Agreement.

Lost Mobile Phone Tracker Portal CEIR

Selfie, Mobile, Phone, Portrait, Hood, Hoodie
CEIR lost mobile phone tracker portal: The Central Equipment Identity Register portal for blocking stolen mobiles will now be available to users in Delhi NCR and help them with lost or stolen mobiles or smartphones.
If you have lost your smartphone or mobile phone, there is now an official government portal to help you block the use of the device, and get some peace of mind. The Central Equipment Identity Register or CEIR, which was launched for Mumbai in September 2019, is now officially open for those residing in Delhi-NCR region.
The idea is that if your mobile gets stolen or lost, you will be able to take some steps on this website in order to ensure that it is blocked. So someone else who stole the mobile or perhaps found it, will be unable to use it. The facility will be extended to other parts of the country in 2020, according to reports. it relies on the International Mobile Equipment Identity or IMEI number to help with tracking. Do keep in mind that one has to file a First Information Report (FIR) after the device is lost or stolen, in order to carry out the steps.
First, they have to submit an FIR with the police about their smartphone or mobile being lost or stolen. A copy of that report should be kept by the concerned user as this will be required for filling up the form on the website eventually. Users should also get their duplicate SIM card from the telecom service provider.
The form requires your primary mobile phone number, and the second one as well if you have one. If you have a dual-SIM phone, you will have to enter the IMEI  number for both as well. You can check the IMEI number from the retail box of the device if you still have it.
IMEI number can be checked from the mobile by dialing *#06# from your device. It is best to note down the number someplace safe for future, in case you do lose the mobile and you don’t have the retail box.

World Biggest Air Purifier

An experimental tower over 100 metres (328 feet) high in northern China – dubbed the world’s biggest air purifier by its operators – has brought a noticeable improvement in air quality, according to the scientist leading the project, as authorities seek ways to tackle the nation’s chronic smog problem.
The tower has been built in Xian in Shaanxi province and is undergoing testing by researchers at the Institute of Earth Environment at the Chinese Academy of Sciences.
The head of the research, Cao Junji, said improvements in air quality had been observed over an area of 10 square kilometres (3.86 square miles) in the city over the past few months and the tower has managed to produce more than 10 million cubic metres (353 million cubic feet) of clean air a day since its launch. Cao added that on severely polluted days the tower was able to reduce smog close to moderate levels.